2008-08-21

First Contest At Rockstartemplate.com - Worth more than 200$


It's quite sometimes now that I've not participating in any contest made by our fellow bloggers. But while I'm browsing around and dropping my entrecard today, I've found a contest that I couldn't resist to participate. this contest is not judge by luck but it is judge by a point that we can accumulate. A contest made by a Rockstartemplate.com which offering a fabulous prizes. I'm listing the 1st place prizes here:

1st Place :

$ 50 Amazon.com Gift Voucher.
$ 15 Hard Cash through Paypal.
$ 20 worth Banner Advertising in Rockstartemplate.com for 1 month.
$ 15 worth Link Placement in PR 4 Blog [My Personal Blog] for 1 month.
And Get a Review at my personal Blog.

You should find the rest of the prizes and contest rules by your self at Rockstartemplate.com. Hurry! The contest ending on September 25th, 2008.


2008-08-04

Week 28/07 to 01/08 Performance

Performance for my first week trade in an InterbankFX live account.
54% gain.


2008-08-01

July NFP—Consensus Estimate 55K to 75K Loss in Payroll Jobs

Release time: Friday, August 1, 2008 — 8:30 AM EST!

U.S. employers trimmed jobs from their payrolls in June for the sixth consecutive month, showing continued—albeit relatively mild—weakness in the labor market. Thus far, job losses are still at a rate soft enough to not pull the overall economy into recession. The Labor Department reported a net loss of 62,000 jobs in June, matching the job loss figure for May, which was revised higher from 49,000. The decline in June employment was slightly worse than the consensus forecast for a 60,000 decline, and brought the number of jobs lost by the U.S. economy so far this year to 438,000.


Several key factors are thought to have influenced the July NFP report. They include:

- An increase in the unemployment rate to 5.5%, matching the May level and consensus expectations.

- The decline of 49,000 (0.04%) in NFPs continues a trend of small declines in payrolls consistent with GDP growth near 1.5%.

- Hourly earnings bounced back to a 0.3% gain after a 0.1% increase in April.

- The four-week moving average for unemployment insurance initial claims neared the worrisome 400,000 benchmark, reaching 390,500—the highest level since the four weeks following 2005's Hurricane Katrina.

For week ending July 19, the Labor Department reported that the advance figure for seasonally adjusted initial claims was 406,000, an increase of 34,000 from the previous week's revised figure of 372,000. They also reported a four-week moving average of 382,500, an increase of 4,500 from the previous week's revised average of 378,000.

While the sequence of negative payroll numbers is certainly not good news for consumers, its relatively soft pace should be kept in perspective. Even incremental gains in economic productivity will keep overall growth slightly positive. While the economic picture isn't necessarily inspiring, neither is it cause for panic. Watch for slow growth ahead.

What is the NFP report?

Of all the world monthly economic reports, the monthly U.S. Non Farm Report (NFP) is the most highly anticipated and has the most dramatic impact on the currency market.

The report, which is released on the first Friday of each month and states the previous month's numbers, provides detailed industry data on employment, hours and earnings of workers on nonfarm payrolls. These numbers are the best way to gauge the current state of the US market as well as the direction that the economy is heading.

What's more, the employment numbers provided by the report are used by the Fed to shape their interest rate policies. The health of the U.S. economy and interest rates translate to the strength or weakness of the U.S. dollar.


2008-07-02

June Non-Farm Payroll - Consensus Estimate 50K to 60K Loss in Payroll Jobs

The unemployment rate in May jumped more than it has in over two decades, reaching its highest level since October 2004 and emphasizing the recessionary risk the U.S. economy is currently facing. The civilian unemployment rate spiked to 5.5 percent from 5.0 percent in April, coming in much worse than the expectation of 5.1 percent. The last time the unemployment rate jumped half a percentage point was February 1985. With nearly 49,000 jobs cut from payrolls following decreases of 28,000 in April and 88,000 in March, May marked the fifth consecutive month of job losses. Overall, the economy has shed 324,000 jobs this year.

The latest decrease was led by declines in construction, professional & business services, retail trade, and manufacturing. Revisions to March and April resulted in a net revision downward of 15,000. On the inflation front, average hourly earnings advanced 0.3 percent in May, coming in above the market projection for a 0.2 percent boost.

With widespread payroll losses, the May non-farm report clearly portrayed further deterioration in the labor sector, lessening the ability of the consumer to support economic growth. The jump in unemployment may very well have been exaggerated for technical reasons such as graduating college students attempting to enter the labor market, but nevertheless points to weakening in employment. May's report has also put the Fed in a tough situation by lowering the odds of a healthy rebound in economic growth later this year. Treasury yields fell on the news and equities fell under downward pressure.

For week ending June 21, the Labor Department reported that the advance figure for seasonally adjusted initial claims was 384,000, unchanged from the previous week's revised figure of 384,000. They also reported a four-week moving average of 378,250, an increase of 2,250 from the previous week's revised average of 376,000.

What is the non-farm payroll report?

Of all the world monthly economic reports, the monthly US NFP report is the most highly anticipated and has the most dramatic impact on the currency market.

The report, which is released on the first Friday of each month and states the previous month's numbers, provides detailed industry data on employment, hours and earnings of workers on nonfarm payrolls. These numbers are the best way to gauge the current state of the US market as well as the direction that the economy is heading.

What's more, the employment numbers provided by the report are used by the Fed to shape their interest rate policies. The health of the US economy and interest rates translate to the strength or weakness of the US dollar.


2008-06-18

Pattern Recognition

1) Double Tops & Double Bottoms

Double Tops do not only provide technical traders with a firm indication of a beginning downward trend; they also prove that price movement is not random, but rather is a clear indication of market sentiment. Double Tops occur when a new high is plotted, raising the resistance level. The price then retraces and declines, only to rise again and reach the same high or resistance level. ( view figure 1 )

Figure 1


As can be seen in figure 1 Double Tops can be thought of as true market sentiment. Traders around the globe push the price to a new high; because the new high is a tad extreme the price is subsequently brought back down. Again traders push up to the same level, testing it just one more time; again the price feels too extreme. The market has decided that an upwards trend is just not in the cards, twice a new high was tested and twice the market sold to push it back down. After noticing a Double Top a trader is generally safe to assume that for the time being the market will move in a downwards trend, thus affording an opportunity to sell, or exit a soon to be falling long position.

Of course, Double Bottoms are just the opposite of Double Tops. Twice the market will test a new low, and twice the market will refuse the idea of pushing beyond that point. The buyers will rally and an uptrend will follow.

2) Triangles

There are three types of triangles that technical traders focus on:
( view figure 2 )

Figure 2

Ascending Triangle, Descending Triangle & Symmetrical Triangle.

Ascending triangles are considered bullish pattern formations, though depending on whether they are formed during an up-trend or a down-trend they may have different implications towards future price movement. Spotted within an up-trend an ascending triangle is typically considered an indication that the upwards trend will continue. Just the opposite, if an ascending triangle forms during a downwards trend it is considered an indication of a trend reversal. Essentially, ascending triangles are comprised of a series of candles that, in accordance with the pattern’s name, form the shape of a triangle. The term ascending triangle refers to the fact that the triangle’s two trend lines are not created equally; the top line of the triangle will represent a fairly even level of high prices, while the lower level of the triangle will represent a continued series of higher lows.

The consolidation between buyers and sellers at an upward slant suggests pressure from the buyers. The resistance line can typically only hold for so long before the buyers get the best of the sellers and the price breaks out in an upwards trend, at which point the resistance level often becomes the new support level; or for a seasoned trader, a wise level to place a stop loss. Figure 3 shows an example of an ascending triangle. As can be seen, it is generally safe to assume that the triangle will break out at least five candles before the actual point of the triangle would form. ( view figure 3 )

Figure 3

Descending triangles, naturally, are just the opposite of ascending triangles. In a downwards trend the triangle forms as an indication that the trend will continue downwards. In an upwards trend the triangle forms as an indication of a trend reversal. Descending triangles are formed when there is a series of progressively lower highs and relatively even lows. As can be seen in the image below the top line or resistance line of the triangle will be angled down, while the lower line or support level will appear as a level horizontal line.


Symmetrical triangles are most often considered a continuation pattern. Symmetrical triangles can be seen as a series of lower highs and higher lows develop forming the shape of a triangle. This pattern represents a struggle between buyers and sellers, as is usually the case with price consolidation; more often than not symmetrical triangles precede a price breakout. Though it is generally safe to assume that symmetrical triangles will only present themselves as an indication that the current trend either upwards or downwards will continue, this may not always be the case. ( view figure 4 )

Figure 4

The good news for seasoned traders is that one need not really know ahead of time where the market will head, the true key is simply to spot the symmetrical triangle developing. As can be seen in the example below once the support or resistance line of the triangle has been penetrated by two to three consecutive candles the trend will more than likely continue in that direction, thus offering traders an excellent entry point.

3) Wedges

Wedges are often considered a difficult pattern to recognize, and or are often confused with triangles. The distinction between wedges and triangles is actually quite clear to the trained eye. The key to spotting the difference is found in the slant or the angle of the support or resistance line. When observing triangles notice that ascending triangles show a flat or even resistance line, conversely descending triangles show a flat or even support line. Symmetrical triangles, as their name suggests, are neither slanted downwards or upwards. Wedges on the other hand, are represented by support and resistance lines that both slant in the same direction, be it up or down. ( view figure 5 )

Figure 5

There are two types of wedges; rising wedges and falling wedges.

Falling wedges are considered bullish pattern formations. When found in a downwards trend the falling wedge suggests a reversal of that trend. When found in an upwards trend the falling wedge suggests a continuation of the upwards trend. The falling wedge is formed by a series of lower highs and lower lows. Notice that both the support and resistance levels of the wedge are slanted downwards, setting the wedge aside from what might be mistaken as a triangle pattern formation. Prices within the falling wedge will continue to tighten until the resistance line is finally penetrated and the breakout upwards begins. Timing a falling wedge is much like timing a triangle formation; one can generally assume that after two to three candlesticks have pushed through the resistance line it is then time to consider hoping on the bandwagon with the rest of the buyers.

Rising wedges, just the opposite of falling wedges, are considered bearish pattern formations and are represented by a series of continued higher highs and higher lows which are narrowing or consolidating. The rising wedge suggests to the trained eye that though the buyers are reaching new highs, these highs a progressively tighter and tighter. These progressively tighter highs indicate that the upwards trend is losing steam. Thus, a rising wedge found in an upwards trend would suggest a trend reversal and a rising wedge found in a downwards trend would suggest a short rally from the buyers, but ultimately a continuation of the downwards trend.
( view figure 6 )

Figure 6

4) Flags & Pennants

Flags and pennants are perhaps the most common of continuation patterns. Spotting a flag or a pennant usually begins with noticing the flag pole, or for more practical purposes, the trend line. Flags and pennants typically form after a substantial trend up or down as an indication that the price is consolidating, or being tested before continuing in the initial direction of the trend. Often the consolidation period (the flag or pennant) is slanted in a direction opposite of the initial trend, this demonstrates the market’s hesitation to continue upwards or downwards, but ultimately it is nothing more than a brief hesitation and an indication to the trained eye that there is safety in staying with the initial trend.

Though both flags and pennants indicate a continuation of the current trend, there is a distinct visual difference between the two. The flag will be represented by a more rectangular consolidation period, ( view figure 7 ) both support and resistance levels will be about an equal distance from one another. A pennant on the other hand will be represented by support and resistance levels that are moving towards one another in the shape of an asymmetrical triangle. Both the flag and the pennant are always spotted at the end of the flag pole, or at the end of a sharp directional trend.

Figure 7

5) Head & Shoulders / Reverse Head & Shoulders

Usually found after a long trend either up or down, as its name suggests head and shoulders are named after the human form. Consisting of three peaks, one of which (the head) is centered and higher than the two lower and relatively equal peaks (the shoulders). Head and Shoulders is perhaps the most well known reversal pattern within technical analysis. Formed after a long upwards trend the left shoulder begins to form while still in the upwards trend. Essentially the left shoulder forms as prices rally up and quickly thereafter retrace, typically the upwards trend line, or resistance level will not be broken as this happens. Notice that the left shoulder seen alone can also be viewed as a forming flag. As the left shoulder finds its end, prices again rally, this time to a new high which will become the head of the pattern. After the high peak or head of the pattern is formed and prices have retraced back down, again prices will rally to near the same level as the left shoulder to form the right shoulder.

Essentially, within an upwards trend prices have attempted to rally three times and each rally has seen limited success, or in other words has been rejected by the sellers. Once the right shoulder breaks through the imaginary support line equal with the right shoulder (the neck line) the reversal of the trend has officially begun. Buyers have tried to continue the upwards trend, and three times have lost their battle to the sellers. A trader who has spotted a forming head and shoulders pattern can usually be quite sure that he or she has seen the end or a long upwards trend. It’s time to cut your losses, secure your profits, or short the market. ( view figure 8 )

Every pattern within technical analysis seems to have its opposite, head and shoulders is no exception to this rule. Reverse head and shoulders represent essentially the same situation as normal head and shoulders, but of course are found in long term downwards trends as opposed to long term upwards trends. Instead of the head and shoulders represented by new peak highs they are represented by new peak lows. The reverse head and shoulders tips the trader that the downwards trend is losing steam as three new lows have been tested and each time bested by the buyers in the market. Again, it’s time to cut your losses, secure your profits, or this time, long the market.

Figure 8


2008-06-09

Basic Concepts

Charting & Charting Styles

‘Charting’ is essentially the most basic component of technical analysis. As such, some would argue that the more raw and basic data plotted on a chart is of little use to the technical trader. Instead, they might argue that a technical trader needs more advanced indicators as a means of determining price direction. Indicators such as moving averages, momentum indicators, oscillators and so on… will, ultimately be of grand use to the technical trader, but not without first learning the basics!

Line Charts

There is nothing more basic than a line chart. A simple visual representation of data, the Line Chart plots the closing price of a single day and over the course of weeks and months connects the dots. The following image shows an example of a basic line chart:( view figure 1 )

The line chart’s simplicity is often seen as its strength. Or so it may be in other markets. In the Forex market the line chart offers very little insight into the market’s volatility or movement within the time frame of a single day. As most Forex traders are ‘day traders’ (often in and out of positions in a 24 hour period) a line chart, even if plotted by the hour, would still leave much to be desired. As we continue to explain other charting methods, the previous point will make more sense!

Bar Charts

Bar charts are in essence the less visually appealing version of Candlestick charts. Candlestick charting is the most popular method used by today’s Forex traders. However, it might be important to understand the one before the other. A Bar Chart displays a price’s open, high, low and closing prices. As shown in the following image the top of the bar chart represents the highest price of the period, and the bottom of the bar represents the lowest price of the period. To the left and right side of the bar are “ticks”, the left tick represents the open price of the period and the right tick represents the close price of the period. ( view figure 2 )

Candlestick Charts

Really the only choice for today’s Forex traders, the candlestick chart offers the same information as does a bar chart, but does so in a much more ascetically pleasing manner. As is illustrated in the following image the candlestick is comprised of a “body” and an upper and lower “wick”. The body of the candle is typically a dark color when the close is at a lower price than was the open (a bearish candle). Conversely, if the close is at a higher price than was the open the candle will be a light color (a bullish candle). The wick of the candle represents the entire range of price for that period. The top of wick of course represents the price at its highest point, while the bottom of the wick represents the price at its lowest point.

A quick glance at a candlestick will tell a trained eye literally everything they might want to know about a price within a certain time frame, i.e. what was the high and low price, was it bullish or bearish, where was the open and close. A trader can also quickly glance at a series of candles and with little thought note how many consecutive candles have been bullish or bearish; which in conjunction with other technical analysis often serves as an appropriate timing method to enter a trade. ( view figure 3 )

What am I looking for?

More often than not, traders in the Forex market doom their own technical analysis. The reason is simple; they look at a chart and try to remember everything that they have ever studied about technical analysis. Before long it seems that one philosophy only contradicts another, an obvious entry becomes a source of confusion and so on. Some of the best traders in world have a bit of a mental check list that is always considered when analyzing a chart. However, they also know that too many technical indicators used in conjunction with one another is a fast track to a certain demise.

There are certainly a few things that you are going to want to consider when looking at a chart. As the course continues you will be better prepared to compile your own trading style. For the time being, consider the following a check list for the novice. Ask yourself what the chart on your screen is telling you, and which of the following considerations are worth considering:

Is there an obvious trend or direction of the market within the time frame that you are viewing?
Are there any basic chart formations such as triangles, wedges, pennants, double tops or bottoms or otherwise that might suggest a pending breakout or trend reversal?

Is the market trading within the walls of any obvious support and resistance levels, or is the market trading within a channel?

Have you considered at least two technical indicators, i.e. two technical indicators that complement each other well?

Have you ignored the impulse to consider every technical indicator that you have ever read a paragraph or two on?

You should now understand at least the basics of what a technical trader is looking for when analyzing a chart and the market. As we continue to dissect various technical indicators and forms of pattern recognition your skills will be refined, for the time being it is enough to know, if nothing else, what it is that you will ultimately be looking for.

Support & Resistance Trends

Fortunately for traders in the Forex market, dealing in this market is often about dealing in trends. It is often said that ‘the trend is your friend’; there is truth to this, but only when a trader understands why the market trends and the underlining factors that can often disassemble a forming trend (these factors will be covered throughout the course as we further analyze technical analysis). ( view figure 4 )

The image above shows an example of an upwards trend. Notice that the trend line was drawn by identifying the lowest low of the trend and connecting the line to the following low preceding a new high. A solid trend line should continue in this manner until at least four lows followed by new highs are plotted. This trend line can also be referred to as a support level. In other words, think of this line as if it were the roof of a house. During this trend period the price range is going to crawl along the roof of the house. In an upwards trend we are obviously looking for an opportunity to buy. It is generally taught that a trader’s best buy entry point during an upwards trend would be at the lowest low of the candle on the third touch of the support level, as is shown in the following image: ( view figure 5 )

Just the opposite of an upwards trend, in a downwards trend our trend line can be referred to as a resistance level. Now as opposed to trading along the outside of a roof we are trading along the top of the ceiling. During this trend a trader can assume that the price is often going to reach the ceiling, but never push through it. A trader following a well developed downwards trend is looking for an opportunity to sell on the third touch of the resistance line at the highest possible point of the candle, as is shown in the following image: ( view figure 6 )

Timing an entry point within a trend is as key as recognizing a trend, as obviously they will not last forever. First consider the time frame of the chart that you are viewing in relation to the likely continuance of the trend. As mentioned earlier, we are usually looking to buy or sell on the third touch of a support or resistance level within a trend. Using historical data in your charts, you will notice that the average trend will not provide more than 3 to 4 additional touches of the support or resistance after the first 3 that would have inspired you to note the trend to begin with. Thus, depending upon whether you are viewing a 1 minute chart, a 5 minute chart, or so on you will need to gage an estimated time frame within which you will trade.


2008-05-27

Technical Analysis

What is Technical Analysis?

“Technical analysis” is an industry term that more often than not sounds much more complicated than the actual process is. Really, it ought to be referred to as “price analysis”, as this would be a more accurate description. Through the use of charted data traders around the world analyze their market of choice. The objective: determine future price movement. The means: understanding price movement patterns of the past.

The charting of price movements creates a visual tug-of-war between buyers and sellers. The large majority of Technical traders in the Forex market focus their attention on candlestick data, a method of charting that offers a visual interpretation of the high, low, open and close of a currency price within a certain time frame.


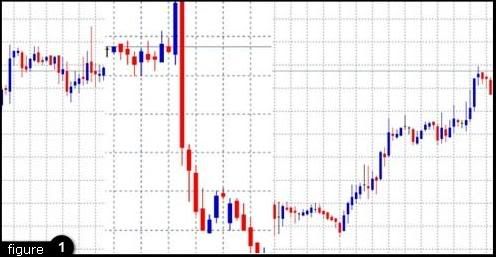
Combined with various forms of pattern recognition , candlestick charting offers traders a visual look at the market’s past prices and trends. Analyzing this historical data in order to predict the movements of future prices is the process known as “technical analysis”. Notice how price patterns formed on the following chart tend to repeat; technical traders attempt to identify patterns of these nature, and base their trades accordingly. ( view figure 1 )


Figure 1


Why Does Technical Analysis Work?


Technical analysis is often dispelled as a myth, even a fool’s errand. There are those who believe that price movement is completely random and completely unpredictable. True, technical analysis is never an exact science (predicting the future never is). However, the true fool would be he or she that ignores the power of technical analysis, particularly in the Forex market.


Analyzing price patterns is actually very similar to analyzing human behavior. While humans can at times be unpredictable in nature, humans are typically considered to be creatures of habit. The average human adheres to certain paradigms, paradigms that are rarely broken. Do you brush your teeth or shower first? Do you comb your hair before or after you shave? The point: if one were to observe an average person’s daily routine before leaving the house for work their behavior may seem random or without purpose. However, if one were to observe the same human day after day, within a relatively short amount of time it would not be hard to outline that person’s morning routine. In fact, nine times out of ten you would probably be able to predict with impressive accuracy how your observed creature would prepare for their day, perhaps even down to the minute.


The Forex market is also a creature of habit. Analyzing price movement is effective because the past can teach us how human beings (the real living and breathing organism of this market) will react to certain situations. History does repeat itself. Technical analysis offers the Forex trader a certain level of expectancy when considering future price movements. In a sense, accurate technical analysis is a trader’s true edge. There is no crystal ball for predicting the future of the market, though there are keys to understanding patterns, past, present and future.


When Does Technical Analysis Fail?


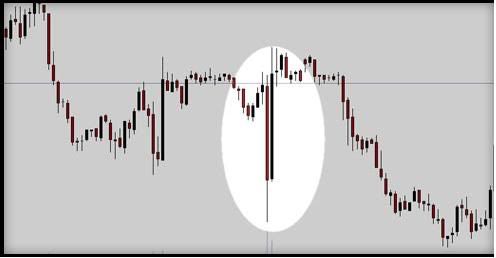
Technical analysis fails when traders fail to consider the fundamentals. Why mention fundamental analysis when explaining technical analysis? Simple, the one just doesn’t work without the other. Fundamental factors such as political events, a hike in interest rates, unemployment rates and so on will impact the Forex market more substantially than perhaps any other market. Fundamental factors are often the driving force of major price movements. A trader focused on technical analysis cannot ignore Nonfarm Payroll on the first Friday of the month and expect his or her technical indications to be as accurate as the day prior. Notice the price movement shown in the following image; shortly after Nonfarm Payroll price reactions were wild; during such times technical analysis cannot be counted on. ( view figure 2 ) Purely technical traders understand that certain political factors throw all other price forecasts out the window.

Figure 2


2008-05-24

List of forex news sources

Looking for Forex News?

Here is the list of some print and web Forex news sources: (listed in an arbitrary order).

ABC News—updates its news several times a day and updates Forex news several times a week. Tends to cover the major events in the world of Forex.
ForexHelp.com—focuses in full length on one major story. Afterwards, it focuses shortly on a few top Forex topics. Then it provides Forex news, which are updated a few times a day. All information is relevant.
Bloomberg.com—provides high quality news. Divides information into several categories to ease your reading. Covers important social, political and economical data.

Reuters—is an excellent source of information. Focuses on worldwide news, has a large global appeal due to its many international offices. News is constantly updated. Offers a lot of Forex news.
MarketWatch, Inc—belongs to Dow Jones & Company, Inc. Provides radio updates every half hour—accessible via their website. Also, is a good provider of special reports.
The Wall Street Journal; The Wall Street Journal Online—provides business news and financial information on a daily basis, including analysis. The site is divided into sub-sites as per the different continents; there are different web versions for the different continents.
BBC NEWS—provides news about all subjects, always in a fresh and professional manner. In their “Economy” section you will find various kinds of economical issues. Search the site for whatever you are looking for and you will surely find it.
The Financial Times Review/ FT.com—report excellently about business. News is updated several times a day. Forex news is updates once a day.
CNBC.com—leads in business news and provides fresh and real-time market coverage. Website offers videos.
CNN.com—is a leader of news both domestically and internationally. Extremely professional, clear, and well written. Forex news can be found on the site, however it is not updated daily. All information on it is relevant and useful.
The Washington Post—reports on many issues and does so in the highest quality. Their “Business” category is large and you will find many interesting articles there.
Guardian Unlimited—covers Forex news, but is not dedicated to it. Does contain much financial, business, economic news. All news is professional, well written, and pleasurable to read.
FX Week—is a good source of Forex news as it focuses on Forex. Provides commentary on Forex technology, strategy, currencies, etc. However most of the information is limited to subscribers only.
Business Week/BusinessWeek.com—leads in business news. Provides news in a wide range of categories, very interesting articles, and has a good search engine.


Risks involved in forex trading

In Forex, emotions can be your worst enemy. Fear, excitement, panic, anticipation can lead you to make a trading decision impulsively, or rush you into a transaction. And oftentimes, this can be not only risky, but also damaging, harmful, and destructive. Trading Forex should be rational, calculated, and well thought through. While making smart decisions does not guarantee a success (it can lead to failed transactions as well) it still allows traders to trade with control. And controlling one’s own trading fate, is a positive thing!

Any investment requires risk taking. Risk is an exposure to the chance of loss. Loss can happen in many ways: it can happen via the change in the price from the closing time of a trading day to the opening time of the following trading day, it can happen as a result of a country’s increasing unemployment rates, or as a result of someone misinterpreting the graphs. Unfortunately, it has happened that people trade and trade their funds, trade on large amounts of leverage, yet cannot back their transactions up, and hence end up losing a lot of money. In this sense, the Forex market is said to be addictive, and in many ways trading is said to be gambling.


How to attempt to limit loss? How to make a smart decision? Educate yourself.

• Not all online games involve real money. Some trading platforms allow you to play without having to risk any money. This means that you cannot win any money, but it also means that you cannot lose any. It does mean that you get to practice your trading skills.
• Use Forex simulations to get hands-on experience without having to risk any money.
• Take classes. Participate in seminars. Join webinars. Attend conferences. Learn the basics of economy and finance.
• Get risk management consultation and advice.
• Inform yourself about Forex strategy tools. Learn how to strategize and how to control risk.
• Trade with a fixed money management strategy. Know what percentage of the account you are willing to risk on any given day. You want your trades to be controlled, disciplined, responsible and always well managed.


Forex Scams


Unfortunately, Forex scams exist. Individuals are led to believe that they can expect to make huge amounts of money by trading in the Foreign Exchange market, when in fact, they cannot. Just as unfortunate is the fact that the amount of Forex scams has increased drastically in recent years. The market is not as regulated as it should be, which allows for such scams and frauds to take place. Moreover, when individuals have been scammed it is oftentimes difficult to prove that such scams took place.

Forex scams come in various forms (and sizes…) When you visit and use Forex websites and/or Forex software be aware of brokers who don’t always tell the truth about the risks involved in trading, of platforms that manipulate the exchange rate, of consultants that don’t look out for your best interest. Look out for programs that supposedly trade on your behalf and always make profits, for programs that provide inaccurate analysis, and automated trading services. Be aware of any trading platforms that promise that there is no risk involved and that this specific program can make you lots and lots of money.

Always double check “facts” and/or promises that you get and find about if they are correct. Make sure to get plenty of information from various different sources, and of course, make sure that you trade on a secure, reliable, safe platform as to guarantee your safety. Be suspicious as to avoid being scammed!


2008-05-23

Forex Scalping

Scalpers… never heard about them? I’m not surprised...because scalpers are a new breed of traders.

The leading principle behind scalping is that smaller price movements are easier to catch than large ones. And the movement is said to usually be of the following nature: a price movement goes in the trader direction for a while before it goes in its trend direction!

So what do scalpers actually do?

Well… they open and close positions in minutes or seconds attempting to make a profit that way. In a single day, scalpers will open and close tens and even hundreds of positions! They try to make many small profits with small price changes.

Scalpers will trade on leverage and hence increase their risk. However, since the trade is for a really short period of time, the risk decreases. It can be said that scalping is in a way a “risk control” strategy.

However, let’s not forget two thing: 1) The spread that you pay… when you open a trade it makes it more profitable to trade long-term, and 2) Since the gain is so minimal, one major loss could eliminate all the other gains, which could be not only extremely frustrating, but also financially destructive!!

Voila, this is Scalping!


2008-05-22

Forex robots and Expert Advisor

Forex Robots… No, this isn’t the title of some new hit Sci-Fi movie about futuristic robots—Forex robots really do exist! Or rather, Forex robot programs exist.

The Forex Robot could be of use to any trader and/or investor. It automatically manages one’s account, hence, functioning like a money manager. It allows the trader/investor to step away from his/her trading platform without having to fear that s/he will “miss out” on a great moneymaking opportunity. The Forex Robot will manage one’s account at all times; it will constantly monitor all market movements and will look out for investment opportunities. The Forex robot is programmed to look for short-term opportunities in the Forex market; during a trading day it will look for opportunities in currency pairs. After closely tracking currency movements it will make decisions based on the market. It will execute them speedily and accurately, like a highly trained, highly skilled professional trader.

Expert traders, investors, and money-managers designed the Forex Robot. Their aim was to create some sort of an alternative to traditional trading, in which the analyzing (of trends) and the execution (of transactions) were to be carried out by a….well, machine. This way, they philosophized, emotions would be eliminated from the trading process…and everyone knows that emotions can be not only irrelevant but also be destructive in trading.

Sounds intriguing? You should check it out… But just remember not to let the robot turn you into a lazy trader….


Forex Currencies Symbols

Do you ever find yourself confused? Unable to tell which Forex symbol means what?

Well…the good news is that we have compiled some Forex symbol lists for you. Firs we will give you a list of currency pairs and their symbols, then we will give you a full list of ALL currencies and their symbols.

Currency pairs list

EUR/USD refers to Euro / US Dollar
USD/JPY refers to US Dollar / Japanese Yen
GBP/USD refers to British Pound / US Dollar
USD/CHF refers to US Dollar / Swiss Franc
USD/CAD refers to US Dollar / Canadian Dollar
AUD/USD refers to Australian Dollar / US Dollar
EUR/JPY refers to Euro / Japanese Yen
EUR/CHF refers to Euro / Swiss Franc
GBP/CHF refers to British Pound / Swiss Franc
GBP/JPY refers to British Pound / Japanese Yen
CHF/JPY refers to Swiss Franc / Japanese Yen
NZD/UZD refers to New Zealand Dollar / US Dollar
USD/ZAR refers to US Dollar / South African Rand
USD/GRD refers to US Dollar / Greek Drachma
USD/SEK refers to US Dollar / Swedish Kroner
USD/NOK refers to US Dollar / Norwegian Kroner
USD/DKK refers to US Dollar / Danish Kroner
USD/FIM refers to US Dollar / Finnish Markka
USD/NLG refers to US Dollar / Dutch Guilder
USD/MXN refers to US Dollar / Mexican Peso
USD/BRL refers to US Dollar / Brazilian Real
USD/IDR refers to US Dollar / Indonesian Rupiah
USD/HKD refers to US Dollar / Hong Kong Dollar
USD/SGD refers to US Dollar / Singapore Dollar
USD/CZK refers to US Dollar / Czech Kroner

Curency symbols list

The symbols are the abbreviations, the three letters that stand for the official name of the currency.

Afghanistan Afghani is referred to as: AFA
Albania Lek is referred to as: ALL
Andorra Peseta is referred to as: ADP
Angolia Kwanza is referred to as: AON
Argentinia Peso is referred to as: ARS
Aruba Guilder is referred to as: AWG
Austrailia Dollar is referred to as: AUD

Bahama Dollar is referred to as: BSD
Bahraini Dinar is referred to as: BHD
Bangladesh Taka is referred to as: BDT
Barbados Dollar is referred to as: BBD
Belize Dollar is referred to as: BZD
Benin/Senegal/Brukina Faso CFA Franc is referred to as: XOF
Bermuda Dollar is referred to as: BMD
Bhutan Ngultrum is referred to as: BTN
Bolivia Bolivianos is referred to as: BOB
Botswana Pula is referred to as: BWP
Brazil Real is referred to as: BRL
British Pound Sterling is referred to as: GBP
Brunei Dollar is referred to as: BND
Bulgaria Lev is referred to as: BGN
Burma Kyat is referred to as: BUK
Burundi Franc is referred to as: BIF

Cambodia Riel is referred to as: KHR
Cameroon/Congo/Chad CFA Franc is referred to as: XAF
Canada Dollar is referred to as: CAD
Cape Verde Escudo is referred to as: CVE
Cayman Islands Dollar is referred to as: KYD
Chile Peso is referred to as: CLP
Chile Unidades De Formento is referred to as: CLF
China Yuan Renminbi is referred to as: CNY
Colombia Peso is referred to as: COP
Comoros Franc is referred to as: KMF
Costa Rica Colones is referred to as: CRC
Cuban Peso is referred to as: CUP
Cyprus Pound is referred to as: CYP

Danish Krone is referred to as: DKK
Djibouti Franc is referred to as: DJF
Dominican is referred to as: Peso

East Caribbean Dollar is referred to as: XCD
Ecuador Sucre is referred to as: ECS
Egypt Pound is referred to as: EGP
El Salvador Colon is referred to as: SVC
Ethiopia Birr is referred to as: ETB
EURO is referred to as: EUR

Falkland Islands Pound is referred to as: FKP
Fiji Dollar is referred to as: FJD
French Polynesia CFP Franc is referred to as: XPF

Gambia Dalasi is referred to as: GMD
Ghana Cedi is referred to as: GHC
Gibraltar Pound is referred to as: GIP
Guatemala Quetzal is referred to as: GTQ
Guinea Franc is referred to as: GNF
Guinea-Bissau Peso is referred to as: GWP
Guyana Dollar is referred to as: GYD

Haiti Gourde is referred to as: HTG
Honduras Lempira is referred to as: HNL
Hong Kong Dollar is referred to as: HKD
Hungry Forint is referred to as: HUF

India Rupee is referred to as: INR
Indonesia Rupiah is referred to as: IDR
Iran Rial is referred to as: IRR
Iraq Dinar is referred to as: IQD
Israel Shekel is referred to as: ILS

Jamaica Dollar is referred to as: JMD
Japan Yen is referred to as: JPY
Jordan Dinar is referred to as: JOD

Kenya Shilling is referred to as: KES
Kuwait Dinar is referred to as: KWD

Laos Republic Kip is referred to as: LAK
Lebanon Pound is referred to as: LBP
Lesotho Maloti is referred to as: LSL
Liberia Dollar is referred to as: LRD
Libia Dinar is referred to as: LYD

Macao Pataca is referred to as: MOP
Malagasy Franc is referred to as: MGF
Malawi Kwacha is referred to as: MWK
Malaysia Ringgit is referred to as: MYR
Maldives Rufiyaa is referred to as: MVR
Malta Lira is referred to as: MTL
Mauritania Ouguiya is referred to as: MRO
Mauritius Rupee is referred to as: MUR
Mexico Peso is referred to as: MXN
Mongolia Turgik is referred to as: MNT
Morocco Dirham is referred to as: MAD
Mozambique Metical is referred to as: MZM
Myanmar Kyat is referred to as: MMK

Nepal Rupee is referred to as: NPR
New Taiwan Dollar is referred to as: TWD
New Zealand Dollar is referred to as: NZD
Nicaragua Cordoba Oro is referred to as: NIO
Nigeria Naira is referred to as: NGN
North Korean Won is referred to as: KPW
Norway Krone is referred to as: NOK

Oman Rial Omani is referred to as: OMR

Pakistan Rupee is referred to as: PKR
Panama Balboa is referred to as: PAB
Papua New Guinea Kina is referred to as: PGK
Paraguay Guarani is referred to as: PYG
Peru Inti is referred to as: PEN
Philippines Peso is referred to as: PHP
Poland Zloty is referred to as: PLN

Qatari Riyal is referred to as: QAR

Republic of Korea Won is referred to as: KRW
Romania Leu is referred to as: ROL
Russia Rouble is referred to as: RUB
Rwanda Franc is referred to as: RWF

Sao Tome Dobra is referred to as: STD
Saudi Arabia Riyal is referred to as: SAR
Seychelles Rupee is referred to as: SCR
Sierra Leone Leone is referred to as: SLL
Singapore Dollar is referred to as: SGD
Solomon Islands Dollar is referred to as: SBD
Somalia Shilling is referred to as: SOS
South Africa Rand is referred to as: ZAR
Sri Lanka Rupee is referred to as: LKR
St Helena Pound is referred to as: SHP
Sudan Dinar is referred to as: SDD
Suriname Guilder is referred to as: SRG
Swaziland Lilangeni is referred to as: SZL
Sweden Krona is referred to as: SEK
Switzerland Franc is referred to as: CHF
Syria Pound is referred to as: SYP

Tanzania Shilling is referred to as: TZS
Thailand Baht is referred to as: THB
Timor Escudo is referred to as: TPE
Tonga Pa'anga is referred to as: TOP
Trinidad and Tobago Dollar is referred to as: TTD
Tunisia Dinar is referred to as: TND
Turkish Lira is referred to as: TRL

U.A.E. Dirham is referred to as: AED
Uganda Shilling is referred to as: UGX
Uruguay Peso is referred to as: UYU

Vanuatu Vatu is referred to as: VUV
Venezuela Bolivar is referred to as: VEB
Vietnam Dong is referred to as: VND

Western Samoa Tala is referred to as: WST

Yemeni Dinar is referred to as: YDD
Yemeni Rial is referred to as: YER

Zaire Zaire is referred to as: ZRZ
Zambia Kwacha is referred to as: ZMK
Zimbabwe Dollar is referred to as: ZWD


2008-05-19

Blast Your Technorati

Here is an easy tag for all my blogger friends. Do it in your free time. It will help to increase your back links and meet more friends.

**Begin Copy**

This is the easy way and the fastest way to :1. Make your Authority Technorati explode.2. Increase your Google Page Rank.3. Get more traffic to your blog.4. Makes more new friends.Rules :1. Start copy from “Begin Copy” until “End Copy” to your blog(for bloggers paste on the “compose” not the “edit html” part in posting blogs so it will be linked automatically).2. Put your own blog name and link.3. Tag your friends as much as you can, the more the better!

1. Picturing of Life 2. Juliana’s Site 3. Hazel-My Life, My Hope, My Future. 4. Jeanne-The Callalily Space 5. Starz in De Sky 6. My Charmed Life 7. Denz Techtronics 8. Denz Recreational 9. Life’s Simple Pleasures 10. My Blog 11. Because Life is Fun 12. In This Game of Life 13. Scribbles of my Life 14. Changing Lanes 15. anna 16. joytoy 17. Surviving deployment 18. The Deviant19. All I want is Everything 20. Shadows of love, fate and destiny 21. Tasteful Voyage 22. A mom’s note 23. Bittersweet Collide 24. Jackie Simplypinay 25. Jackie’s Everyday Life 26. Parisukat 27. Ang Sponge ni Bub 28. ee-ey 29. Life is too short to be ordinary 30. Asian Mutt International 31. Sunny Side Up Foodie 32. Almanac Queen 33. Caramel Corn 34. Snapshot 35.Forex: My Trading Style 36. You're Next....

**END COPY**

2008-05-18

Forex Strategies

Trading the Forex market is a smart move. There are many Forex strategies to implement, and they will help you invest your money wisely. However, no matter how well you have studies, researched, and examined a strategy, it will always remain risky. So whenever if you choose to trade in the Foreign Exchange market, always remember that you are taking a risk. Having said this, history has proven that certain trading strategies work. Following are several strategies that traders use in their attempts to make a profit—and you can learn from them.

Trend following is a Forex strategy used by all sorts of Forex traders. It basically says that if a certain trend is in place, it will continue to be in place. If a financial instrument is acting in one way (as per the trend) then it will continue to do so. For example, if the value of a certain currency has been rising, then it will continue to rise, or, if the value of a certain currency has been falling, it will continue to fall.

Contrarian is a market-timing Forex strategy used by all sorts of Forex traders. It basically says that if a certain trend is in place, it will reverse. If a financial instrument is acting in one way (as per the trend) then it must begin to act in a contradictory way. For example, if the value of a certain currency has been rising steadily, then it will start to fall, or, if the value of a certain currency has been falling, it will begin to rise. Traders will buy and sell based on the above notion; they will buy an instrument that has been falling, or, sell one that has been rising.

Range trading is in a way opposite of trending, because it follows the range of a certain instrument and claims that an instrument has a certain range (of highs and lows) in which it operates. So every time it rises to its high, it must move back down, and every time it falls to its low, it must move back up. Trading this way is called “trading in a range”.

But there is a notion of trending even in range trading. For example, if an instrument has moved outside of its range, then it is believed that it will continue to follow that trend. This is to say, that if an instrument has broken its range and its price has moved up, then its price will continue to rise for a while longer (and vice versa).

Scalping is a Forex strategy that takes advantage of the small differences that are created by the bid-ask spread. The only way to make a profit from this strategy is to make small and fast moves. Scalping exploits the inefficiency of the market when instability and unpredictability increases and when trading ranges expand.

News trading is used frequently and specifically by day traders which tend to trade as per the news. That is to say, to trade based on current events. Traders open positions following major news releases. The reason this technique is used mainly by day traders is because such opportunities are usually short-lived; they may last for only a few minutes or even only a few seconds. If some country released an economic report showing a growth in its Gross Domestic Product (GDP), then this may influence the value of that nation’s currency—a rising trend in the GDP shows that the economy is growing stronger, and hence, day traders may choose to invest in that country’s currency. But like already said, the opportunity to do so is usually short-lives, and hence, only day traders can benefit from such opportunities.

Perhaps you will not be surprised to know that many traders will chose to reverse these strategies. I.e. to operate in a way that completely contradicts these techniques. They will purposefully trade against those who trade using the strategies above.


Day Trading

Day trading is a term that refers to the time frame in which traders choose to trade. If a trader buys and sells financial instruments (financial instruments are: stocks, stock options, currencies, and a host of futures contracts such as equity index futures, interest rate futures, and commodity futures) within the same trading day, i.e. closes positions before the end of the trading day, then it is correct to say that s/he is day trading. As opposed to day trading, the term over night trading also exists, and it means that positions remain open until the next trading day. The Foreign Exchange market (Forex market) has many day traders.

Some day traders open one position a day, other open dozens. Some day traders focus on extremely short-term trading (seconds, minutes) whereas others prefer long-term trading. Many day traders believe that they must close their position before the market closes as to avoid the risk of changes in the price (i.e. to avoid situations in which large differences between the previous day’s close price and the next day’s open price exist.) Of course, then there are other traders that choose to do the exact opposite…. Either way, trading has undergone a transformation. And so has day trading. Up until not too long ago, day trading was something that only financial firms and professional investors engaged in. However, with the introduction of trading software and online trading, all sorts of individuals have adopted day trading.

One trading technique frequently used by day traders (specifically by Forex day traders) is trading as per the news. That is to say, to base trades on current events; traders open positions following major news releases. The reason this technique is used mainly by day traders is because such opportunities (changes in the value of currencies as a result of news releases) are usually short-lived; they may last for only a few minutes or even only a few seconds. That is to say, if some country released an economic report showing a growth in its Gross Domestic Product (GDP) then this may influence the value of that nation’s currency—a rising trend in the GDP shows that the economy is growing stronger, and hence, many day traders may choose to invest in that country’s currency. But like already said, the opportunity to do so is usually short-lives, and hence, only day traders can benefit from such opportunities.


Forex Advantages

Investors and speculators using the Internet as an investment tool will find that the Forex market offers several advantages over equities trading.
( view figure 1 )

*200:1 is the entry leverage value. Brokerages will have margin calls set at different levels, exact leverage may vary. **The traders cost of doing business is called the Spread. It is the difference between the bid and the ask price on your chosen currency pair.

I) 24-Hour Trading

Forex is a true 24 hour market, 5.5 days a week, which offers a major advantage over equities trading. Investors are able to trade at odd hours, thus allowing more flexibility for personal, business and social activities. Whether trading at 8am, 2pm, or even 2am, there will always be buyers and sellers actively trading foreign currencies. Such flexibility allows traders to immediately respond to breaking news and other political factors driving the market.
( view figure 2 )

After hours trading in the equities market has several limitations. In the US, for example, equities traders have access to ECNs (Electronic Communications Networks), also known as “matching systems”. These networks are established to provide a method for equities traders to buy and sell amongst each other. Such networks are usually not able to offer as tight of spreads as would be offered during normal market hours, thus most trades are not executed at a fair market price, subsequently there is no guarantee that every trade will be executed.

II) Unmatched Liquidity

An investment market with lacking liquidity, or a lack of buyers and sellers at certain times, is often the demise of traders who need in or out of the market without delay. The global network of governments, banks, corporations, hedge funds, and individual traders that collectively drive the Forex market, are in essence, also driving the world’s largest network of liquidity. Such high trade volume works to ensure trade execution and the stability of prices, regardless of the time of day.
Equities traders, on the other hand, are more susceptive to liquidity risk and are subject to potentially wider dealing spreads and larger price movements. Liquidity in the equities market really does pale in comparison to that of the Forex market.

III) High Leverage

Leverage is the key to understanding the risk associated with trading the Forex Market, and of course, the potential for gain. Many Forex brokers offer leverage as high as 200 – 1, meaning that $50 of margin would control a $10,000 position in the market (this is an example of a mini lot). ( view figure 3 ) Forex trading is often attractive to investors coming from the equities market because Forex trading offers such high leverage. It is important to understand why Forex brokers offer higher leverage, and of course… the dangers associated with such.

To some extent, higher leverage is a necessary evil in the Forex market. It can offer advantages over equities trading, but only if it is properly understood and utilized. Though currency values on a global stage are constantly in a state of flux, high liquidity and market stability translate to relatively small daily price movements. In fact, average daily movement is around 1% on most major pairs. Compare that to the equities market, where average daily movements are closer to 10% and it is not hard to understand why large contracts are needed in order to yield profits on intraday price movements.

Without high leverage most retail investors would not be able to afford trading in the Forex market. However, with increased buying power comes increased risk. Traders who are new to the market often make the mistake of over-trading their account. Because relatively small margin is required to open large positions beginning traders often make the mistake of opening too many positions at one time. A quick market move can then result in substantial losses. IBFX would advise any trader new to the Forex market to trade only a very small percentage of their account at any one time.


IV) Profit Potential in Both Rising and Falling Markets

Like any market, there is always a buyer and a seller the world of currencies. The potential for profit will of course rally between the buyers and sellers, the longs and the shorts. Trading currencies in pairs offers the advantage of speculation from either side, but it is the volatility in combination with excellent liquidity that offers currency investors a true advantage over any other market. Regardless of the time of day, traders in the Forex market can long or short any currency pair of their choice.

Many brokers also offer hedging, meaning that traders can take a long and short position on the same currency pair. The market’s volatility provides the constant potential for gain, and of course, the constant potential for loss as well. Forex trading can be risky, but execution in or out of trades should not be a problem when trading through a reputable broker. Equities traders, on the other hand, may have a much more difficult time liquidating stocks when the market is moving against them.


Disadvantage - Higher Risk

The off-exchange retail foreign currency market (or Forex market) has many differences, as outlined above. However, one of the most significant factors is the element of risk. The Forex market is the riskiest of all investment vehicles and is suitable only for experienced traders. The higher leverage and volatility found in this market increase the traders risk of loss. There is the potential to lose, all or more, of your original investment.


Forex: Introduction To...

Forex does not have to be complicated. It can be simple, straightforward, and extremely interesting. Before jumping in, it is crucial that we understand the Forex basics. This overview will explain all the Forex basics in the most comprehensible way.

Forex is short for Foreign Exchange (Forex market is short for Foreign Exchange market). It is also referred to as merely the two letters FX. The Foreign Exchange market is an international market in which currencies are being sold and bought. Currency is money; it is used as a medium of exchange; hence, the Foreign Exchange market is a market in which money is being sold and bought, in which money is being exchanged.

Think about it this way: When you walk into a store, you buy an apple and you pay with dollars, right? In the Foreign Exchange market you buy one currency (just like the apple) with another currency (just like the dollar). Instead of an apple, for example, you could buy a Euro (the official currency of the European Union), and you could pay for it with USD (the official currency of the United States of America). Makes sense, right?

The value of currencies is not set in stone. Rather, it fluctuates; at times it decreases and at times, it increases. For now let’s not focus on the reasons for these changes, but lets just know that such changes exist (and constantly happen). One currency’s value is measured against the value of another currency. The way it is done is via an exchange rate. This is to say, that the exchange rate will inform you how much of a certain currency you can buy and how much it will cost you (like we already established, we are paying with one currency for the purchase of another currency)

In the Foreign Exchange market currencies are traded in real-time. Since the value of currencies changes (from second to second, minute to minute, month to month, year to year, etc, etc, etc) it is possible to make a profit from such transactions. If you are able to determine which currency’s value will increase by the end of a determines time (such as five minutes after placing the investment, or an hour, or two hours, etc), you will be able to make a profit.

For example: Lets say that you have 1 USD to spend. And let’s say you want to buy JPY (the Japanese Yen is the official currency of Japan). You learn that with 1 dollar you are able to buy 2.34 JPY and so you do exactly that. Now, an hour passes and you learn that with 1 USD you can now buy 2.50 JPY. This means that the dollar is now stronger than it was only an hour ago—because with the same amount of an investment (your initial 1 USD) you are now able to get more JPY (2.50 as opposed to 2.34).