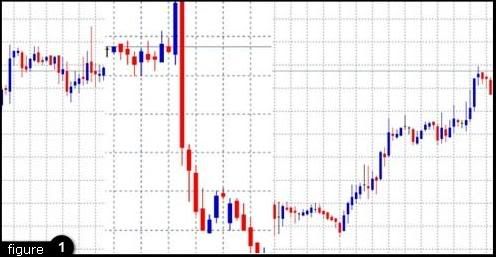
Double Tops do not only provide technical traders with a firm indication of a beginning downward trend; they also prove that price movement is not random, but rather is a clear indication of market sentiment. Double Tops occur when a new high is plotted, raising the resistance level. The price then retraces and declines, only to rise again and reach the same high or resistance level. ( view figure 1 )
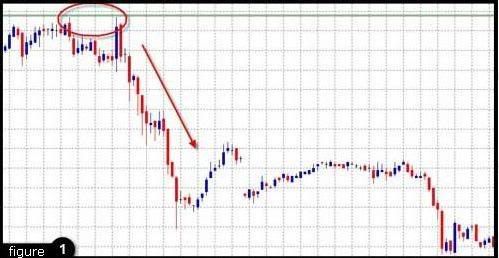
Figure 1
As can be seen in figure 1 Double Tops can be thought of as true market sentiment. Traders around the globe push the price to a new high; because the new high is a tad extreme the price is subsequently brought back down. Again traders push up to the same level, testing it just one more time; again the price feels too extreme. The market has decided that an upwards trend is just not in the cards, twice a new high was tested and twice the market sold to push it back down. After noticing a Double Top a trader is generally safe to assume that for the time being the market will move in a downwards trend, thus affording an opportunity to sell, or exit a soon to be falling long position.
Of course, Double Bottoms are just the opposite of Double Tops. Twice the market will test a new low, and twice the market will refuse the idea of pushing beyond that point. The buyers will rally and an uptrend will follow.
2) Triangles
There are three types of triangles that technical traders focus on:
( view figure 2 )
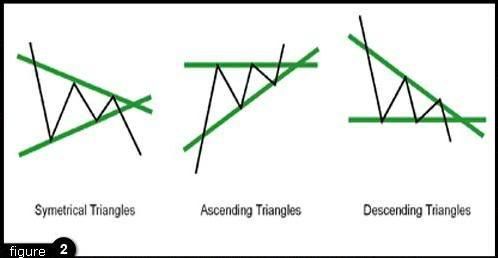 Figure 2
Ascending Triangle, Descending Triangle & Symmetrical Triangle.
Ascending triangles are considered bullish pattern formations, though depending on whether they are formed during an up-trend or a down-trend they may have different implications towards future price movement. Spotted within an up-trend an ascending triangle is typically considered an indication that the upwards trend will continue. Just the opposite, if an ascending triangle forms during a downwards trend it is considered an indication of a trend reversal. Essentially, ascending triangles are comprised of a series of candles that, in accordance with the pattern’s name, form the shape of a triangle. The term ascending triangle refers to the fact that the triangle’s two trend lines are not created equally; the top line of the triangle will represent a fairly even level of high prices, while the lower level of the triangle will represent a continued series of higher lows.
The consolidation between buyers and sellers at an upward slant suggests pressure from the buyers. The resistance line can typically only hold for so long before the buyers get the best of the sellers and the price breaks out in an upwards trend, at which point the resistance level often becomes the new support level; or for a seasoned trader, a wise level to place a stop loss. Figure 3 shows an example of an ascending triangle. As can be seen, it is generally safe to assume that the triangle will break out at least five candles before the actual point of the triangle would form. ( view figure 3 )
 Figure 3
Descending triangles, naturally, are just the opposite of ascending triangles. In a downwards trend the triangle forms as an indication that the trend will continue downwards. In an upwards trend the triangle forms as an indication of a trend reversal. Descending triangles are formed when there is a series of progressively lower highs and relatively even lows. As can be seen in the image below the top line or resistance line of the triangle will be angled down, while the lower line or support level will appear as a level horizontal line.
Symmetrical triangles are most often considered a continuation pattern. Symmetrical triangles can be seen as a series of lower highs and higher lows develop forming the shape of a triangle. This pattern represents a struggle between buyers and sellers, as is usually the case with price consolidation; more often than not symmetrical triangles precede a price breakout. Though it is generally safe to assume that symmetrical triangles will only present themselves as an indication that the current trend either upwards or downwards will continue, this may not always be the case. ( view figure 4 )
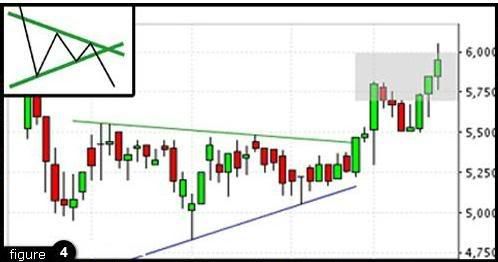 Figure 4
The good news for seasoned traders is that one need not really know ahead of time where the market will head, the true key is simply to spot the symmetrical triangle developing. As can be seen in the example below once the support or resistance line of the triangle has been penetrated by two to three consecutive candles the trend will more than likely continue in that direction, thus offering traders an excellent entry point.
3) Wedges
Wedges are often considered a difficult pattern to recognize, and or are often confused with triangles. The distinction between wedges and triangles is actually quite clear to the trained eye. The key to spotting the difference is found in the slant or the angle of the support or resistance line. When observing triangles notice that ascending triangles show a flat or even resistance line, conversely descending triangles show a flat or even support line. Symmetrical triangles, as their name suggests, are neither slanted downwards or upwards. Wedges on the other hand, are represented by support and resistance lines that both slant in the same direction, be it up or down. ( view figure 5 )
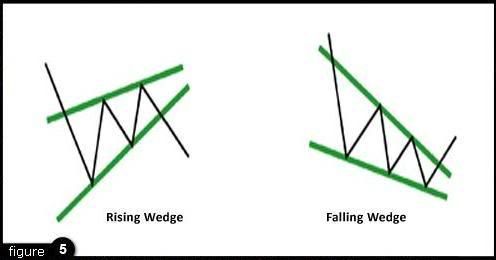 Figure 5
There are two types of wedges; rising wedges and falling wedges.
Falling wedges are considered bullish pattern formations. When found in a downwards trend the falling wedge suggests a reversal of that trend. When found in an upwards trend the falling wedge suggests a continuation of the upwards trend. The falling wedge is formed by a series of lower highs and lower lows. Notice that both the support and resistance levels of the wedge are slanted downwards, setting the wedge aside from what might be mistaken as a triangle pattern formation. Prices within the falling wedge will continue to tighten until the resistance line is finally penetrated and the breakout upwards begins. Timing a falling wedge is much like timing a triangle formation; one can generally assume that after two to three candlesticks have pushed through the resistance line it is then time to consider hoping on the bandwagon with the rest of the buyers.
Rising wedges, just the opposite of falling wedges, are considered bearish pattern formations and are represented by a series of continued higher highs and higher lows which are narrowing or consolidating. The rising wedge suggests to the trained eye that though the buyers are reaching new highs, these highs a progressively tighter and tighter. These progressively tighter highs indicate that the upwards trend is losing steam. Thus, a rising wedge found in an upwards trend would suggest a trend reversal and a rising wedge found in a downwards trend would suggest a short rally from the buyers, but ultimately a continuation of the downwards trend.
( view figure 6 )
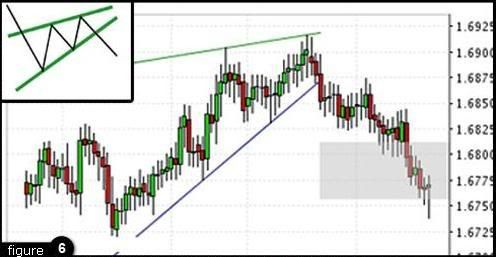 Figure 6
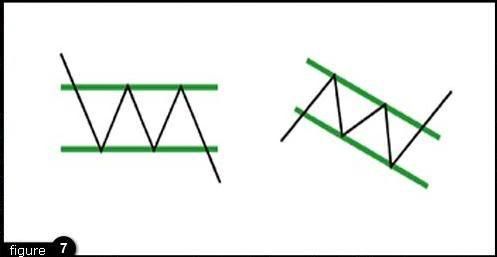 Figure 7
5) Head & Shoulders / Reverse Head & Shoulders
Usually found after a long trend either up or down, as its name suggests head and shoulders are named after the human form. Consisting of three peaks, one of which (the head) is centered and higher than the two lower and relatively equal peaks (the shoulders). Head and Shoulders is perhaps the most well known reversal pattern within technical analysis. Formed after a long upwards trend the left shoulder begins to form while still in the upwards trend. Essentially the left shoulder forms as prices rally up and quickly thereafter retrace, typically the upwards trend line, or resistance level will not be broken as this happens. Notice that the left shoulder seen alone can also be viewed as a forming flag. As the left shoulder finds its end, prices again rally, this time to a new high which will become the head of the pattern. After the high peak or head of the pattern is formed and prices have retraced back down, again prices will rally to near the same level as the left shoulder to form the right shoulder.
Essentially, within an upwards trend prices have attempted to rally three times and each rally has seen limited success, or in other words has been rejected by the sellers. Once the right shoulder breaks through the imaginary support line equal with the right shoulder (the neck line) the reversal of the trend has officially begun. Buyers have tried to continue the upwards trend, and three times have lost their battle to the sellers. A trader who has spotted a forming head and shoulders pattern can usually be quite sure that he or she has seen the end or a long upwards trend. It’s time to cut your losses, secure your profits, or short the market. ( view figure 8 )
Every pattern within technical analysis seems to have its opposite, head and shoulders is no exception to this rule. Reverse head and shoulders represent essentially the same situation as normal head and shoulders, but of course are found in long term downwards trends as opposed to long term upwards trends. Instead of the head and shoulders represented by new peak highs they are represented by new peak lows. The reverse head and shoulders tips the trader that the downwards trend is losing steam as three new lows have been tested and each time bested by the buyers in the market. Again, it’s time to cut your losses, secure your profits, or this time, long the market.
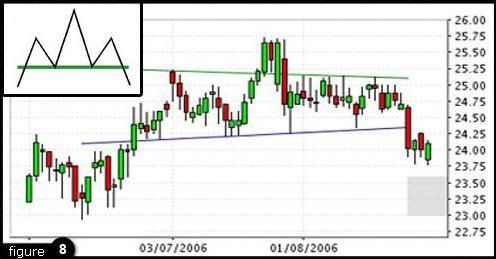 Figure 8
Of course, Double Bottoms are just the opposite of Double Tops. Twice the market will test a new low, and twice the market will refuse the idea of pushing beyond that point. The buyers will rally and an uptrend will follow.
2) Triangles
There are three types of triangles that technical traders focus on:
( view figure 2 )
Figure 2Ascending triangles are considered bullish pattern formations, though depending on whether they are formed during an up-trend or a down-trend they may have different implications towards future price movement. Spotted within an up-trend an ascending triangle is typically considered an indication that the upwards trend will continue. Just the opposite, if an ascending triangle forms during a downwards trend it is considered an indication of a trend reversal. Essentially, ascending triangles are comprised of a series of candles that, in accordance with the pattern’s name, form the shape of a triangle. The term ascending triangle refers to the fact that the triangle’s two trend lines are not created equally; the top line of the triangle will represent a fairly even level of high prices, while the lower level of the triangle will represent a continued series of higher lows.
The consolidation between buyers and sellers at an upward slant suggests pressure from the buyers. The resistance line can typically only hold for so long before the buyers get the best of the sellers and the price breaks out in an upwards trend, at which point the resistance level often becomes the new support level; or for a seasoned trader, a wise level to place a stop loss. Figure 3 shows an example of an ascending triangle. As can be seen, it is generally safe to assume that the triangle will break out at least five candles before the actual point of the triangle would form. ( view figure 3 )
Figure 3Descending triangles, naturally, are just the opposite of ascending triangles. In a downwards trend the triangle forms as an indication that the trend will continue downwards. In an upwards trend the triangle forms as an indication of a trend reversal. Descending triangles are formed when there is a series of progressively lower highs and relatively even lows. As can be seen in the image below the top line or resistance line of the triangle will be angled down, while the lower line or support level will appear as a level horizontal line.
Symmetrical triangles are most often considered a continuation pattern. Symmetrical triangles can be seen as a series of lower highs and higher lows develop forming the shape of a triangle. This pattern represents a struggle between buyers and sellers, as is usually the case with price consolidation; more often than not symmetrical triangles precede a price breakout. Though it is generally safe to assume that symmetrical triangles will only present themselves as an indication that the current trend either upwards or downwards will continue, this may not always be the case. ( view figure 4 )
Figure 43) Wedges
Wedges are often considered a difficult pattern to recognize, and or are often confused with triangles. The distinction between wedges and triangles is actually quite clear to the trained eye. The key to spotting the difference is found in the slant or the angle of the support or resistance line. When observing triangles notice that ascending triangles show a flat or even resistance line, conversely descending triangles show a flat or even support line. Symmetrical triangles, as their name suggests, are neither slanted downwards or upwards. Wedges on the other hand, are represented by support and resistance lines that both slant in the same direction, be it up or down. ( view figure 5 )
Figure 5Falling wedges are considered bullish pattern formations. When found in a downwards trend the falling wedge suggests a reversal of that trend. When found in an upwards trend the falling wedge suggests a continuation of the upwards trend. The falling wedge is formed by a series of lower highs and lower lows. Notice that both the support and resistance levels of the wedge are slanted downwards, setting the wedge aside from what might be mistaken as a triangle pattern formation. Prices within the falling wedge will continue to tighten until the resistance line is finally penetrated and the breakout upwards begins. Timing a falling wedge is much like timing a triangle formation; one can generally assume that after two to three candlesticks have pushed through the resistance line it is then time to consider hoping on the bandwagon with the rest of the buyers.
Rising wedges, just the opposite of falling wedges, are considered bearish pattern formations and are represented by a series of continued higher highs and higher lows which are narrowing or consolidating. The rising wedge suggests to the trained eye that though the buyers are reaching new highs, these highs a progressively tighter and tighter. These progressively tighter highs indicate that the upwards trend is losing steam. Thus, a rising wedge found in an upwards trend would suggest a trend reversal and a rising wedge found in a downwards trend would suggest a short rally from the buyers, but ultimately a continuation of the downwards trend.
( view figure 6 )
Figure 64) Flags & Pennants
Flags and pennants are perhaps the most common of continuation patterns. Spotting a flag or a pennant usually begins with noticing the flag pole, or for more practical purposes, the trend line. Flags and pennants typically form after a substantial trend up or down as an indication that the price is consolidating, or being tested before continuing in the initial direction of the trend. Often the consolidation period (the flag or pennant) is slanted in a direction opposite of the initial trend, this demonstrates the market’s hesitation to continue upwards or downwards, but ultimately it is nothing more than a brief hesitation and an indication to the trained eye that there is safety in staying with the initial trend.
Though both flags and pennants indicate a continuation of the current trend, there is a distinct visual difference between the two. The flag will be represented by a more rectangular consolidation period, ( view figure 7 ) both support and resistance levels will be about an equal distance from one another. A pennant on the other hand will be represented by support and resistance levels that are moving towards one another in the shape of an asymmetrical triangle. Both the flag and the pennant are always spotted at the end of the flag pole, or at the end of a sharp directional trend.
Though both flags and pennants indicate a continuation of the current trend, there is a distinct visual difference between the two. The flag will be represented by a more rectangular consolidation period, ( view figure 7 ) both support and resistance levels will be about an equal distance from one another. A pennant on the other hand will be represented by support and resistance levels that are moving towards one another in the shape of an asymmetrical triangle. Both the flag and the pennant are always spotted at the end of the flag pole, or at the end of a sharp directional trend.
Figure 75) Head & Shoulders / Reverse Head & Shoulders
Usually found after a long trend either up or down, as its name suggests head and shoulders are named after the human form. Consisting of three peaks, one of which (the head) is centered and higher than the two lower and relatively equal peaks (the shoulders). Head and Shoulders is perhaps the most well known reversal pattern within technical analysis. Formed after a long upwards trend the left shoulder begins to form while still in the upwards trend. Essentially the left shoulder forms as prices rally up and quickly thereafter retrace, typically the upwards trend line, or resistance level will not be broken as this happens. Notice that the left shoulder seen alone can also be viewed as a forming flag. As the left shoulder finds its end, prices again rally, this time to a new high which will become the head of the pattern. After the high peak or head of the pattern is formed and prices have retraced back down, again prices will rally to near the same level as the left shoulder to form the right shoulder.
Essentially, within an upwards trend prices have attempted to rally three times and each rally has seen limited success, or in other words has been rejected by the sellers. Once the right shoulder breaks through the imaginary support line equal with the right shoulder (the neck line) the reversal of the trend has officially begun. Buyers have tried to continue the upwards trend, and three times have lost their battle to the sellers. A trader who has spotted a forming head and shoulders pattern can usually be quite sure that he or she has seen the end or a long upwards trend. It’s time to cut your losses, secure your profits, or short the market. ( view figure 8 )
Every pattern within technical analysis seems to have its opposite, head and shoulders is no exception to this rule. Reverse head and shoulders represent essentially the same situation as normal head and shoulders, but of course are found in long term downwards trends as opposed to long term upwards trends. Instead of the head and shoulders represented by new peak highs they are represented by new peak lows. The reverse head and shoulders tips the trader that the downwards trend is losing steam as three new lows have been tested and each time bested by the buyers in the market. Again, it’s time to cut your losses, secure your profits, or this time, long the market.
Figure 8